Dangerous Roads and Intersections in Atlanta

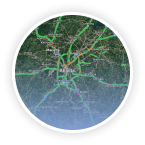
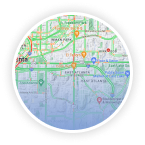
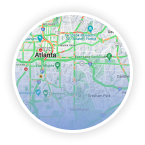
Have you ever wondered which roads and intersections in the Atlanta area are the most dangerous? A car accident can happen on any road, but some are clearly more dangerous than others. The interactive map allows you to see which roads are the most dangerous in the metro Atlanta area. You can chart reports of fatal crashes related to drunk driving, aggressive driving, distracted driving, and other contributing factors. Click on the boxes next to the types of accidents to select the results you wish to view. You can decide which Atlanta roads and intersections you want to avoid.
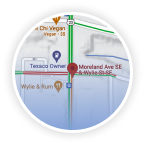
Interactive Fulton Atlanta
Car Accident Map
Select Year
2015
2016
2017
2018
2019
2020
Drunk Driving
Fatalities
The Most Dangerous Intersections in Georgia Are in Metro Atlanta

Certain roads and intersections are known to be the scenes of frequent accidents. The following are among the most dangerous roads and intersections in the metro Atlanta area based on a 2022 analysis of federal traffic data by MoneyGeek:

Moreland Avenue between S. River Industrial Blvd. SE to Wylie Street SE map
Moreland Avenue between S. River Industrial Blvd. SE to Wylie Street SE
Georgia Hwy 85 from I-75 (Exit 237A) to Springdale Drive map
Georgia Hwy 85 from I-75 (Exit 237A) to Springdale Drive
I-285 from Bouldercrest Road exit to the I-20 interchange map
I-285 from Bouldercrest Road exit to the I-20 interchange
I-285 between the Camp Creek Parkway interchange and the Riverdale  map
I-285 between the Camp Creek Parkway interchange and the Riverdale 
I-20 from Panola Road to Candler Road exit map
I-20 from Panola Road to Candler Road exit

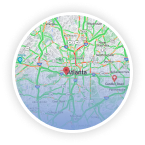
Fulton County had the most fatal accidents of any county in Georgia. Drunk driving and speeding were the leading contributors to fatal accidents.


Source: Study by MoneyGeek based on analysis of Georgia fatality data from the National Highway Traffic Safety Administration from 2018-2020

Common Causes of Accidents

Certain roads and intersections are known to be the scenes of frequent accidents. The following are among the most dangerous roads and intersections in the metro Atlanta area based on a 2022 analysis of federal traffic data by MoneyGeek:

Impaired driving
Impaired driving

Impaired driving is a factor in many intersection accidents. Drivers who are drunk or impaired by drugs may drive at high speeds or fail to yield when traffic lights change to red.

Speeding
Speeding

Speeding also is a contributing factor in a significant percentage of fatal accidents. The faster a vehicle is traveling, the greater the impact in a collision and the more severe the injuries. Speeding reduces the amount of time a driver has to recognize a traffic hazard and react to avoid a crash. It also increases the distance needed to stop a vehicle.

distracted driving
distracted driving

There is a growing awareness of the serious risks posed by distracted driving. Distracted driving involves any activity that takes a driver’s focus off the task of driving and remaining alert to surrounding traffic.  Drivers who are distracted by a cell phone, texting, talking to a passenger, looking at a navigation system, or other factors are at increased risk of being in distracted driving accidents.

Georgia Rates Compared To The Rest Of The U.S.
Car crash
Year Fatalities Total Vehicle Miles
Traveled (Millions)
Fatalities Per 100 Million
Vehicle Miles Traveled
Total Population Fatalities Per 100,000 Population
2017 Georgia 1,540 124,733 1.23 10,417,031 14.78
US 37,473 3,210,248 1.17 3,210,248 11.53
Best State* 0.55 4.45
2018 Georgia 1,505 131,456 1.14 131,456 14.31
US 36,835 3,240,327 1.14 3,240,327 11.27
Best State* 0.53 4.4
2019 Georgia 1,492 133,128 1.12 133,128 14.04
US 36,355 3,261,772 1.11 3,261,772 11.07
Best State* 0.52 3.25
2020 Georgia 1,658 115,967 1.43 115,967 15.46
US 39,007 2,903,622 1.34 2,903,622 11.77
Best State* 0.63 4.88
2021 Georgia 1,797 120,685 1.49 10,799,566 16.64
US 42,939 3,140,088 1.37 331,893,745 12.94
Best State* 0.71 5.75
Fatalites per 100 Million VMT
Fulton County
Fatality Type Fatalities Fatalities Per 100,000 Population
2017 2018 2019 2020 2021 2017 2018 2019 2020 2021
Total Fatalities (All Crashes)* 115 131 144 145 154 11.06 12.46 13.52 13.56 14.46
(1) Alcohol-Impaired Driving (BAC=.08+) Fatalities 28 37 42 34 94 2.69 3.52 3.94 3.18 3.19
(2) Single Vehicle Crash Fatalities 51 72 75 66 154 4.9 6.85 7.04 6.17 8.82
(3) Large Truck Involved Crash Fatalities 20 11 25 15 19 1.92 1.05 2.35 1.4 1.78
(4) Speeding Involved Crash Fatalities 21 27 30 43 31 2.02 2.57 2.82 4.02 2.91
(5) Rollover Involved Crash Fatalities 10 16 15 23 22 0.96 1.52 1.41 2.15 2.07
(6) Roadway Departure Involved Crash Fatalities 30 39 45 56 73 2.88 3.71 4.23 5.24 6.85
(7) Intersection (or Intersection Related) Crash Fatalities 43 29 45 30 28 4.13 2.76 4.23 2.81 2.63
Passenger Car Occupant Fatalities 45 48 45 60 59 4.33 4.56 4.23 5.61 5.54
Light Truck Occupant Fatalities 16 21 32 29 34 1.54 2 3 2.71 2.71
Motorcyclist Fatalities 14 21 22 14 11 1.35 2 2.07 1.31 1.03
Pedestrian Fatalities 36 37 34 37 45 3.46 3.52 3.19 3.46 4.22
Bicyclist (or Other Cyclist) Fatalities 2 2 5 2 1 0.19 0.19 0.47 0.19 0.09
Georgia Traffic Fatalities
Georgia Fatalities by Age
Age Group 2015 2016 2017 2018 2019 2020
< 5 19 16 17 16 15 21
5 -- 9 16 24 16 12 12 12
10 -- 15 24 30 22 22 28 29
16 -- 20 125 139 136 109 106 136
21 -- 24 135 140 130 141 121 113
25 -- 34 260 299 287 285 281 334
35 -- 44 194 212 192 215 216 250
45 -- 54 197 215 238 210 215 221
55 -- 64 200 211 228 237 212 249
65 -- 74 150 149 145 145 160 143
> 75 110 119 128 112 126 126
Unknown 2 2 1 1 0 26
Total 1432 1556 1540 1505 1492 1664
Georgia Speeding-Related Traffic Fatalities
Roadway Function Class 2015 2016 2017 2018 2019 2020
Interstate Rural 6 4 9 4 9 11
Interstate Urban 26 29 36 29 40 29
Non-Interstate 5 5 2 5 1 13
Principal Arterial 48 53 52 53 51 70
Minor Arterial 54 70 47 70 73 91
Collector 61 59 55 59 42 83
Local 68 48 47 48 44 82
Total 268 268 248 268 260 379
Georgia Fatalities by Highest Driver Blood Alcohol Concentration (BAC) in the Crash
Highest Driver* BAC in the Crash 2015 2016 2017 2018 2019 2020
BAC = .00 1014 1111 1114 1052 1064 1178
BAC = .01-.07 59 63 66 71 72 78
BAC = .08+ 358 378 357 379 355 402
BAC = .01+ 417 442 424 450 427 481

If you are one of the thousands of people in Georgia who are injured because of another driver’s negligence, the dedicated and compassionate team at Butler Kahn is ready to help. Because we limit the number of cases we take on, we are able to provide the top-quality legal services and personalized advocacy each of our clients deserves. We’re not afraid to do the hard work necessary to fight for our clients’ best interests and demand meaningful results. When you’re ready to discuss your case, contact Butler Kahn to find out how we can put our experience and skills to work for you.

Telephone Contact Us Now
For Legal Help
678-940-1444 Free Consultation

This field is for validation purposes and should be left unchanged.
Get a Free Consultation
Agree To Terms(Required)

Lawrenceville Office
245 W. Crogan Street
Lawrenceville, GA 30046
Roswell Office
1255 Canton St UNIT E
Roswell, GA 30075
Jonesboro Office
21 Lee Street, Suite 250
Jonesboro, GA 30236